


![Netflix Horizon Zero Dawn TV Show Reportedly In Trouble [Update]](https://i.kinja-img.com/image/upload/c_fill,h_675,pg_1,q_80,w_1200/cc9a42c0341c691ff31e3f12daeddc34.jpg)
Why Did the Bitcoin Price Crash Below $70K and is the Bleeding Over? (Bitcoin Price Analysis)
Bitcoin’s price has been having difficulty approaching its all-time high of $75K and is still consolidating. On Friday, the cryptocurrency tanked below $70K, and if the current level supporting the price breaks down, an even deeper correction could be expected. Technical Analysis By TradingRage The Daily Chart On the daily timeframe, the price has been […]
Bitcoin’s price has been having difficulty approaching its all-time high of $75K and is still consolidating.
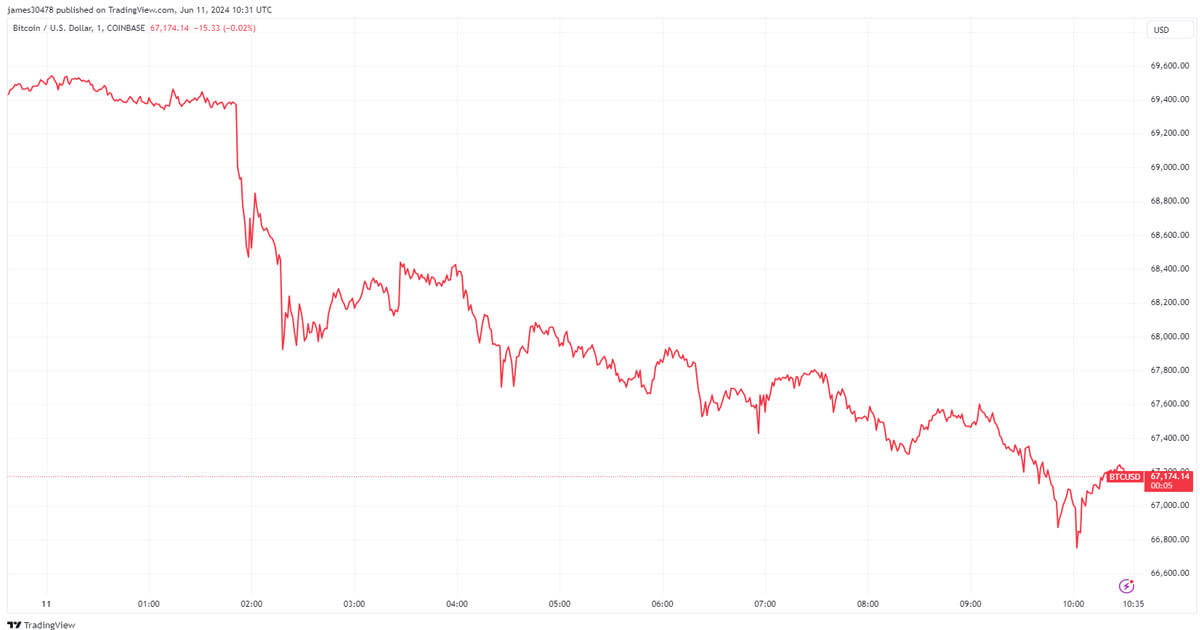
On Friday, the cryptocurrency tanked below $70K, and if the current level supporting the price breaks down, an even deeper correction could be expected.
Technical Analysis
By TradingRage
The Daily Chart
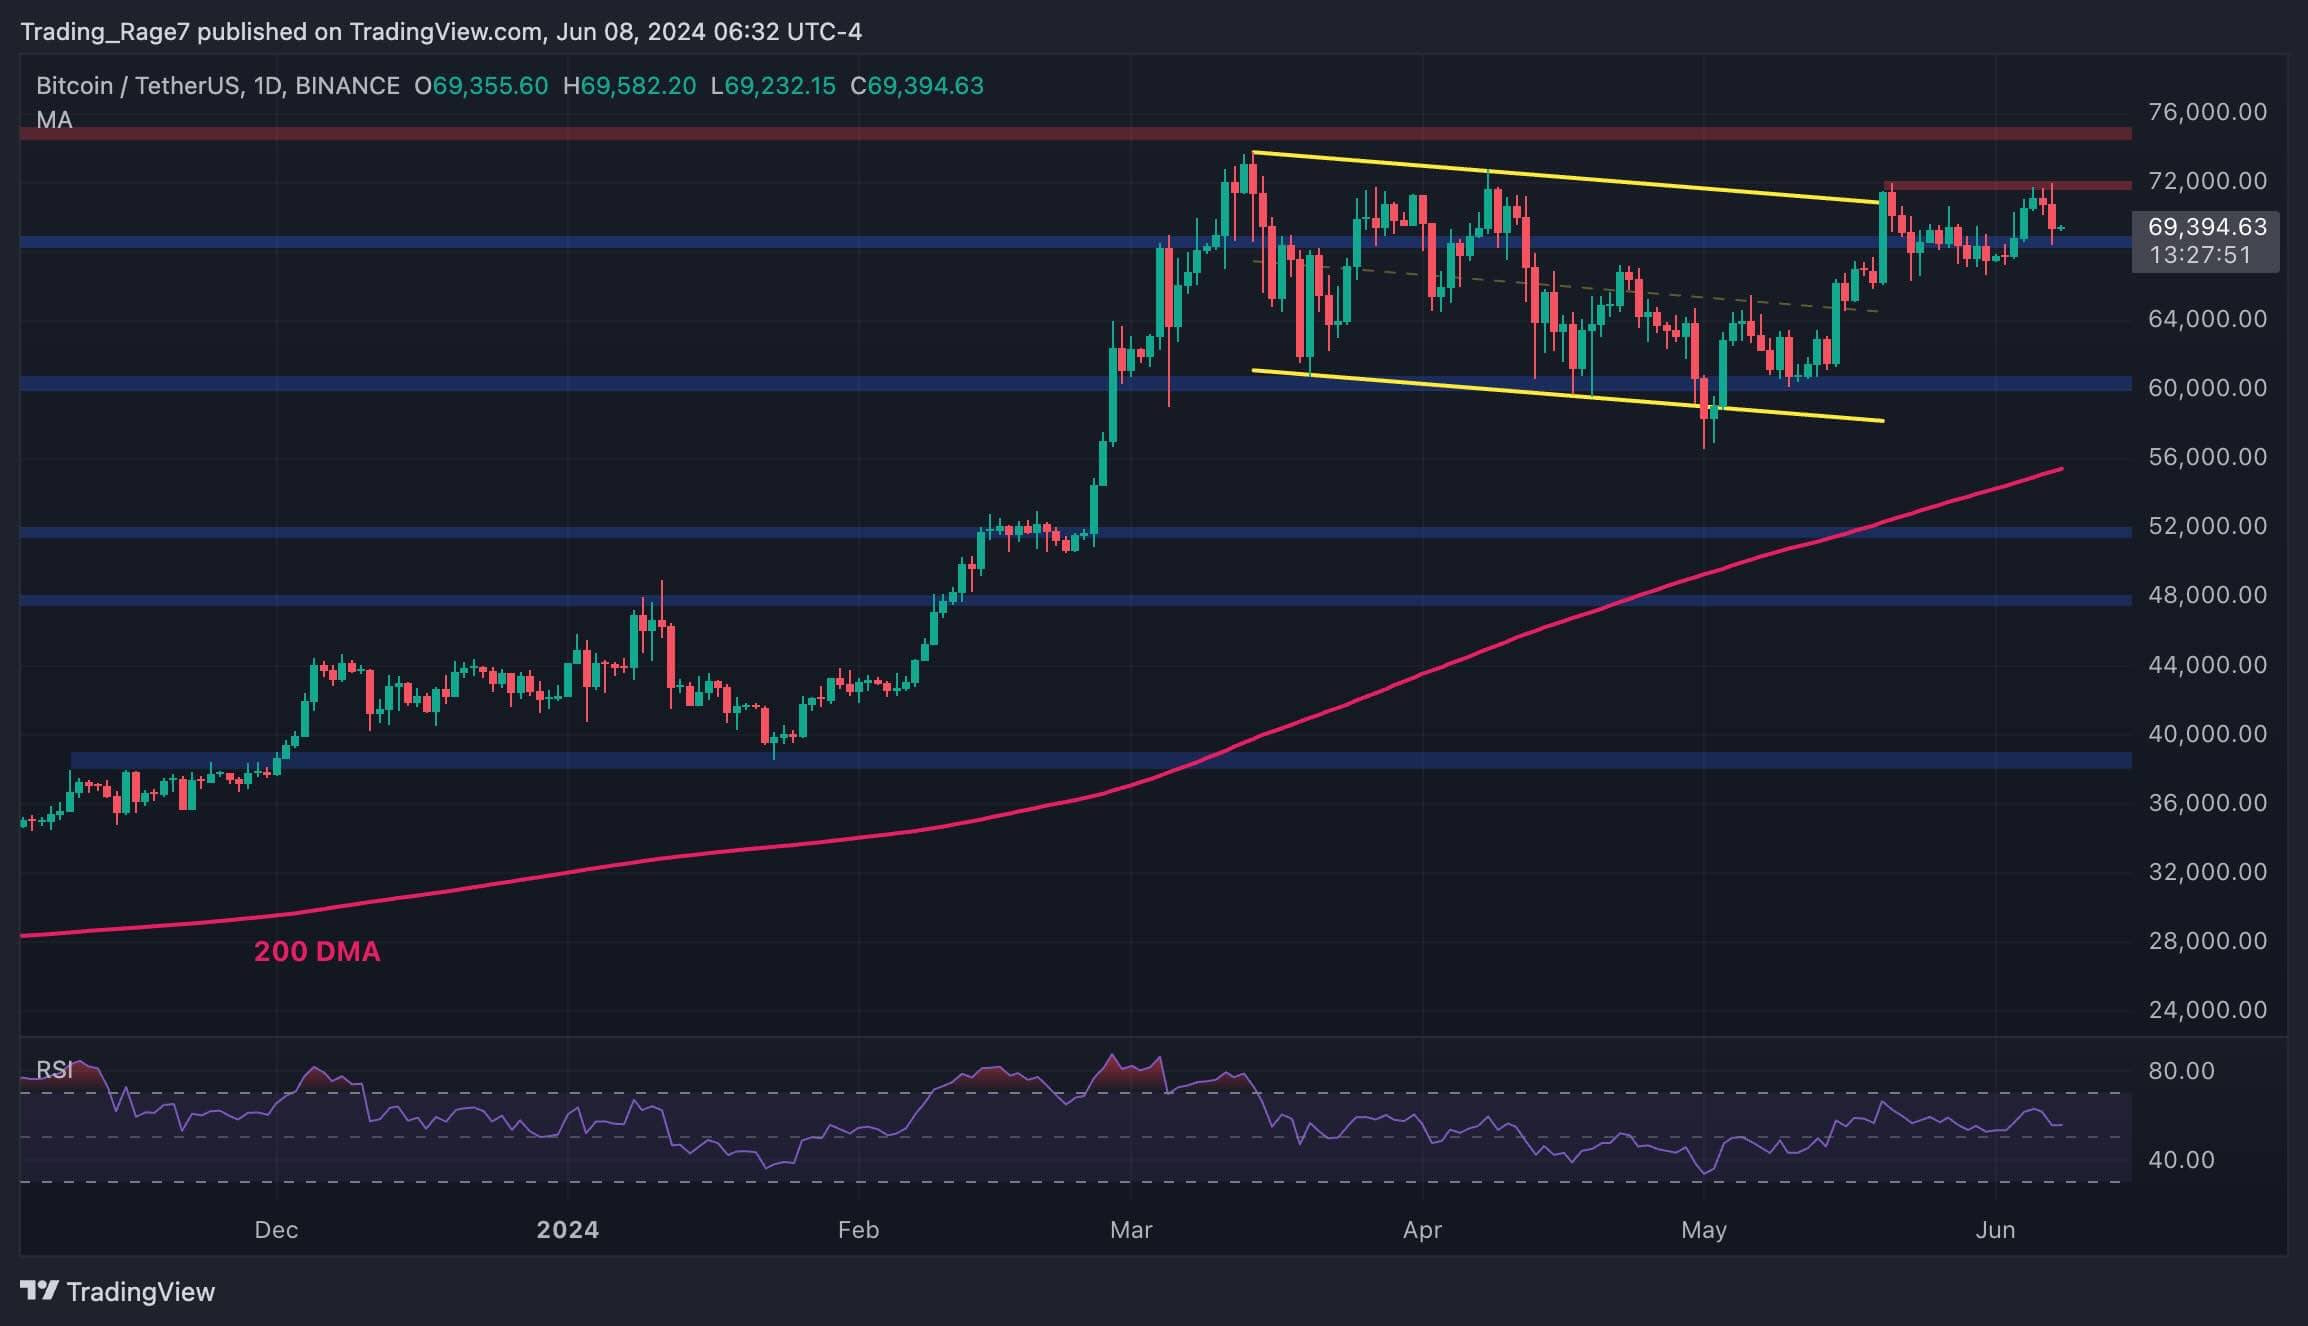
On the daily timeframe, the price has been hovering around the higher boundary of the large descending channel, failing to break it to the upside with momentum. The $69K support zone is currently holding BTC, preventing it from dropping back inside the channel and toward the $60K level.
If the market somehow breaks above the $72K resistance level, a rally toward the $75K record high and even further would be imminent.

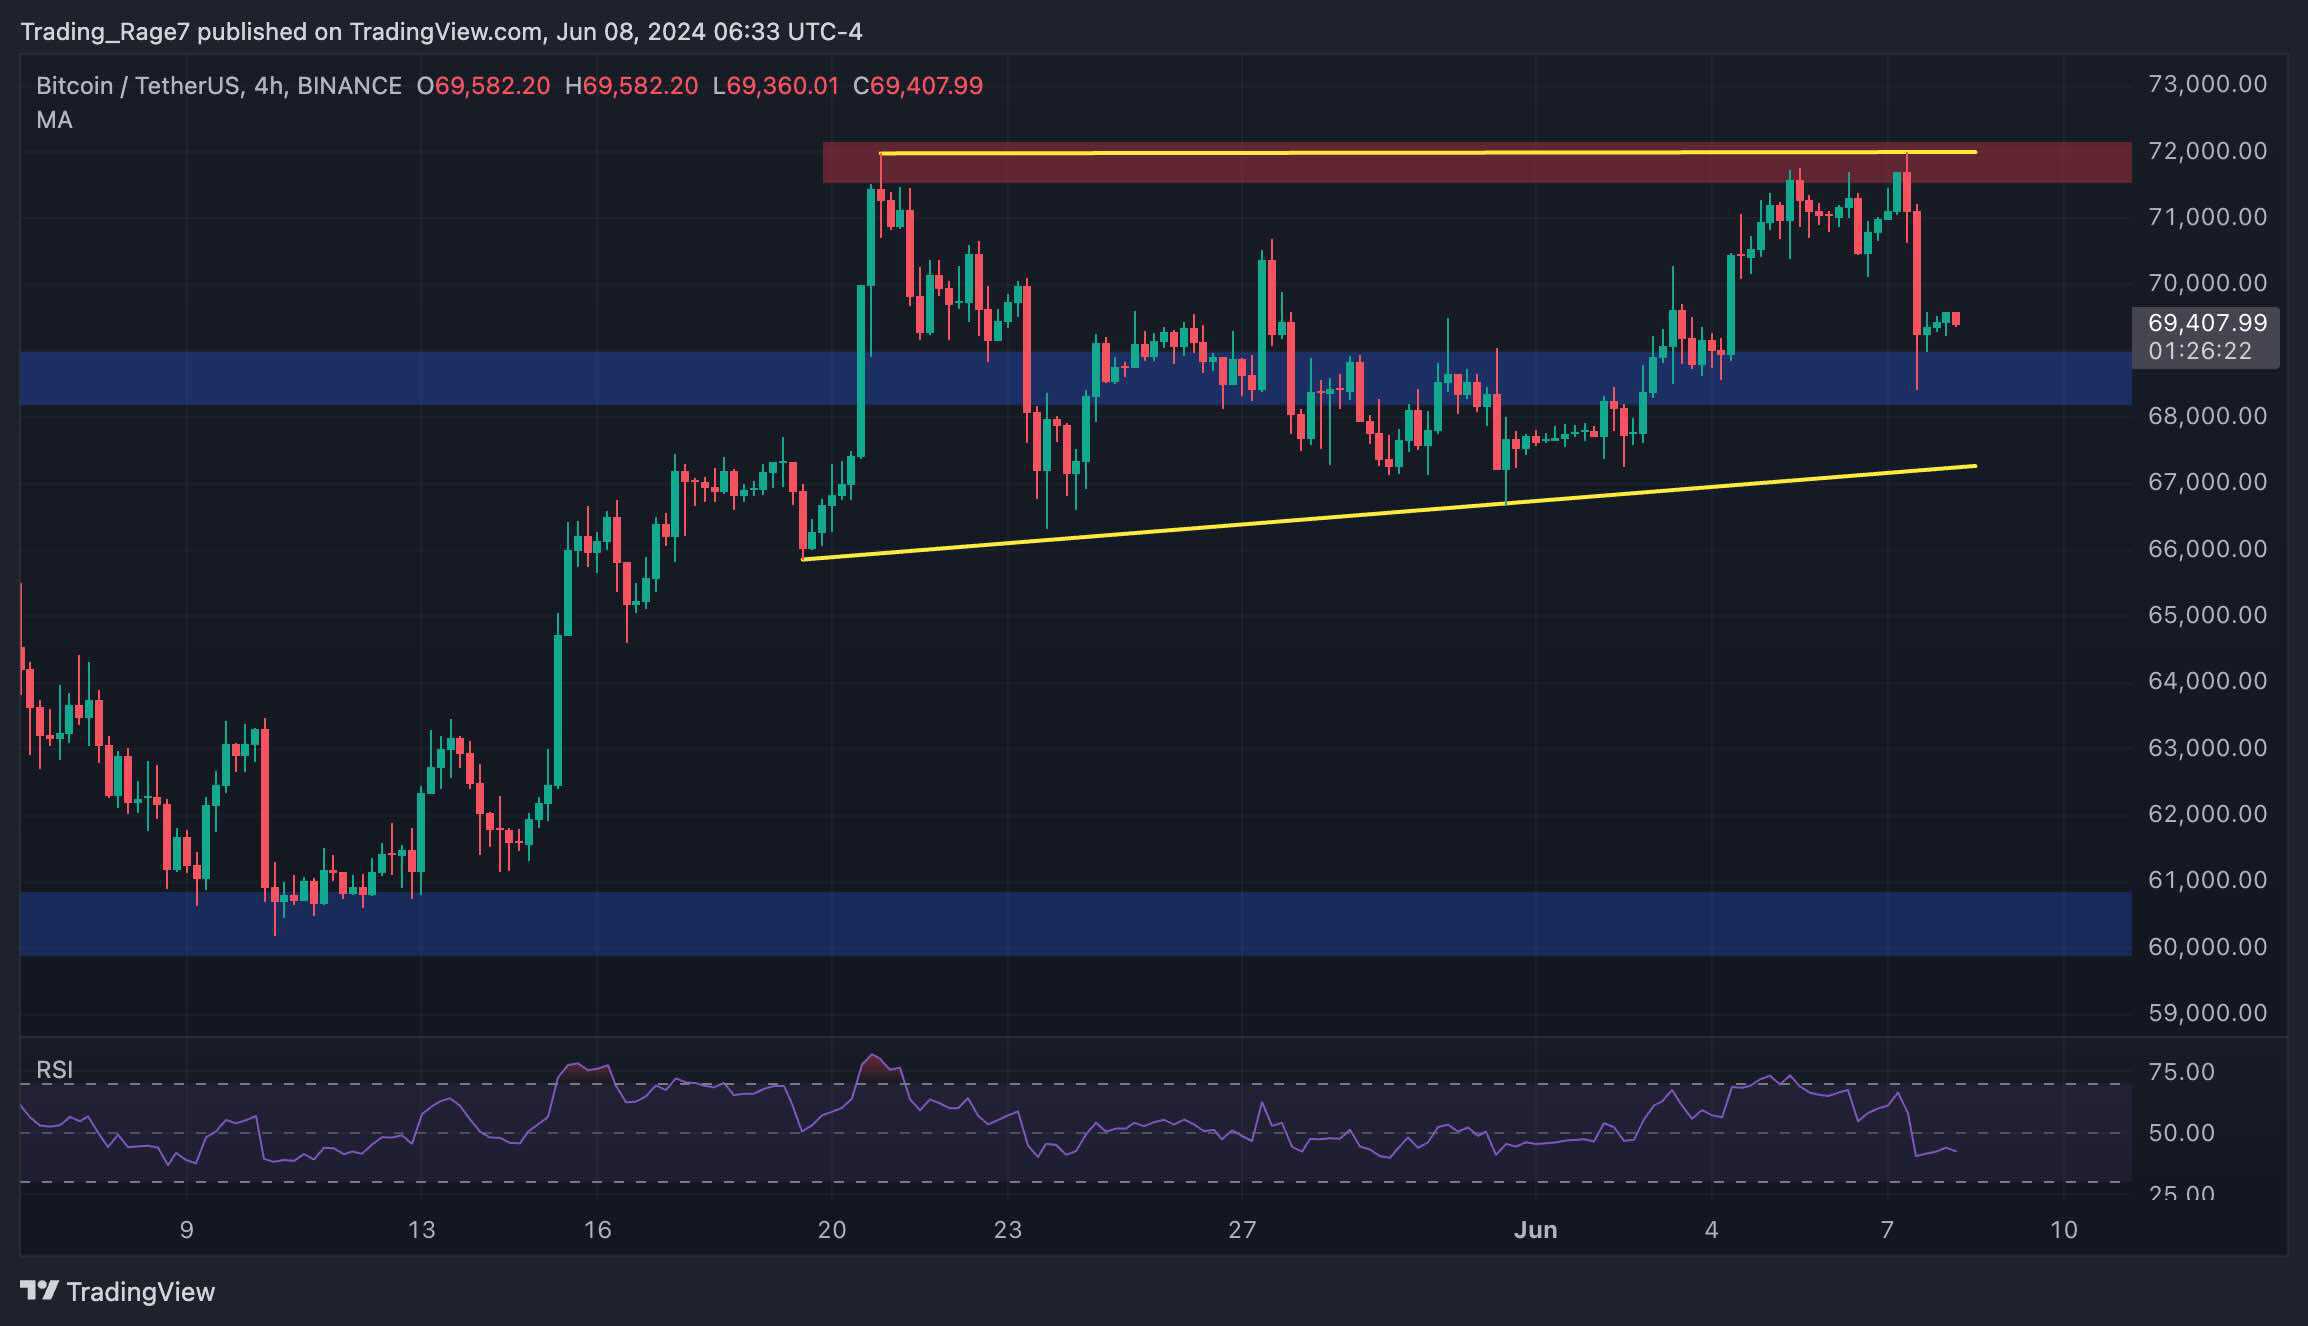
The 4-Hour Chart
Looking at the 4-hour chart, things seem tricky for Bitcoin. An ascending channel is currently being formed around the $70K mark. The price has already tested the pattern’s higher trendline and the $72K resistance level twice. It was rejected decisively and is testing the $69K support level once again.
A breakdown of this level could cause even more trouble. If the pattern is broken to the downside, a deeper drop toward the $60K would likely materialize in the short term.
With the RSI also below 50%, the bearish scenario seems probable.
Sentiment Analysis
By TradingRage
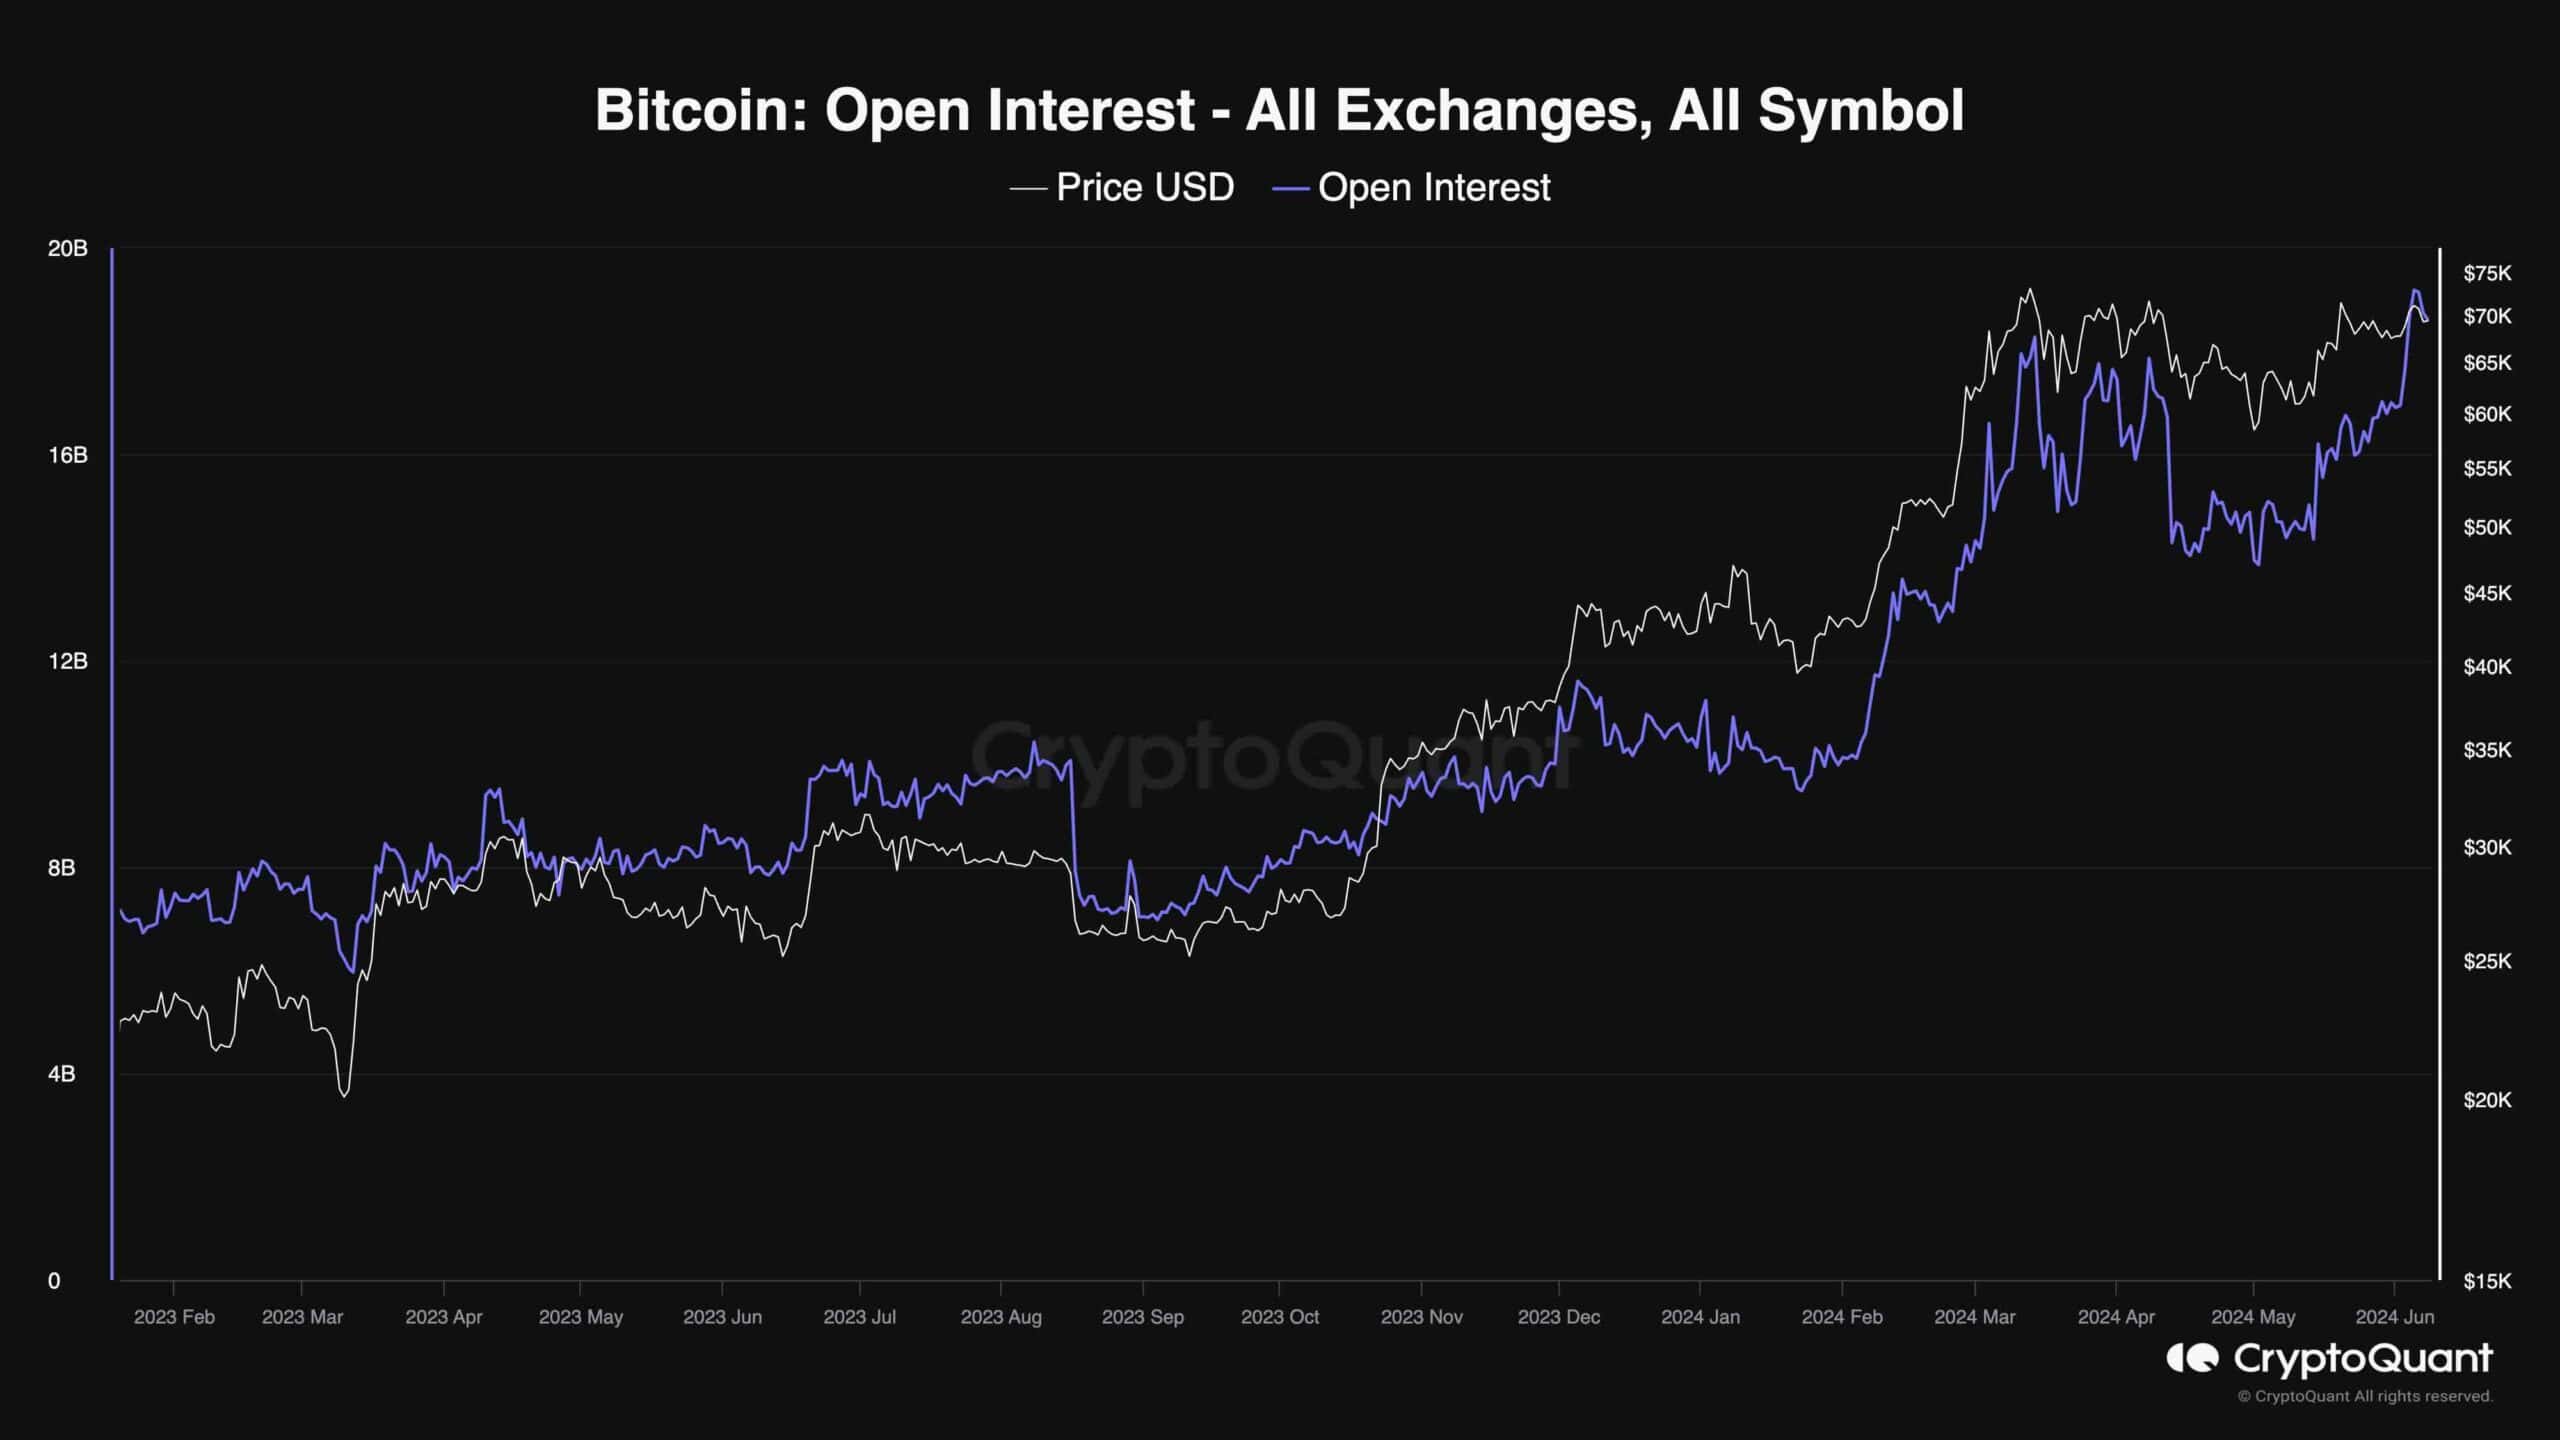
Open Interest
With Bitcoin’s price failing to make a new all-time high, investors are looking for a culprit. While the spot market metrics seem solid, the futures market can be responsible.
This chart presents the Bitcoin open interest, which measures the number of open futures positions in all exchanges. The higher the open interest, the more probable a liquidation cascade is.
A bearish divergence has formed, with the open interest making an all-time high recently and the price failing to do so. This has led to the correction that occurred yesterday. While it is still unclear whether the price can move higher, high open interest values are usually bearish for the market.
The post Why Did the Bitcoin Price Crash Below $70K and is the Bleeding Over? (Bitcoin Price Analysis) appeared first on CryptoPotato.
What's Your Reaction?