


Ethereum Explodes Past $4,000 as Bulls Now Eye All-Time High Levels (ETH Price Analysis)
Ethereum’s price has been rallying rapidly over the last few weeks, breaking past several resistance levels. Yet, the price has reached a significant level that could hold the market for a while. Technical Analysis By TradingRage The Daily Chart On the daily chart, the price has been steadily rising, making higher highs and lows. The […]
Ethereum’s price has been rallying rapidly over the last few weeks, breaking past several resistance levels. Yet, the price has reached a significant level that could hold the market for a while.
Technical Analysis
By TradingRage
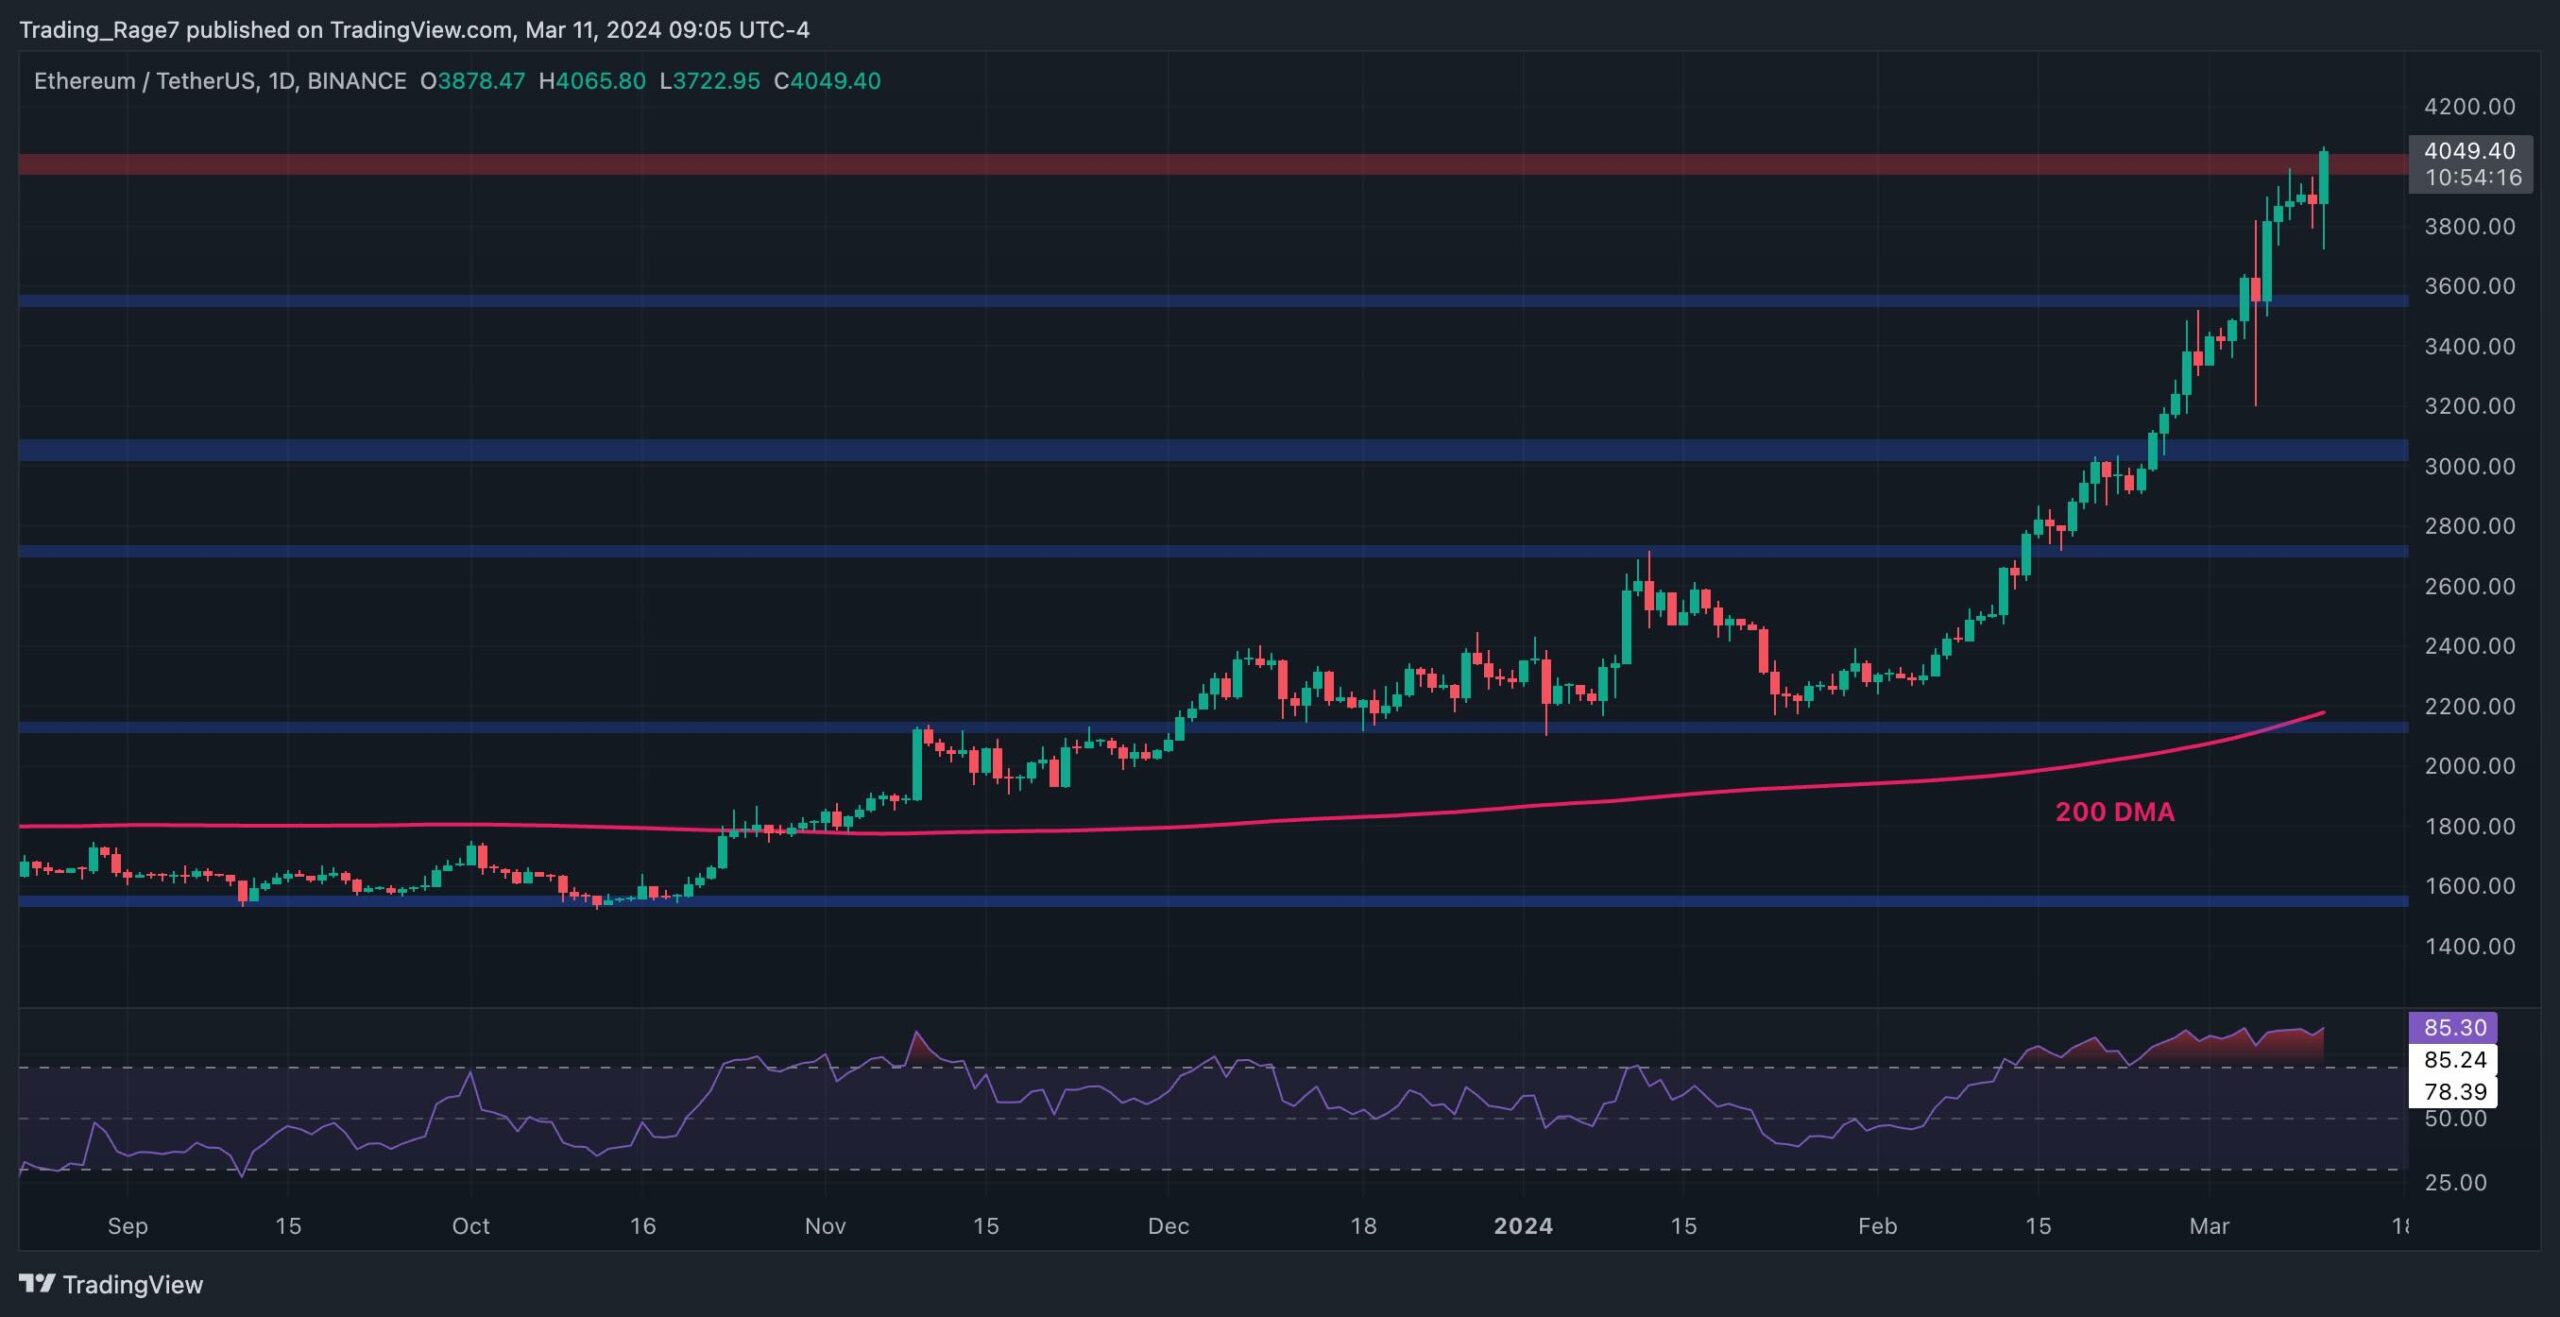
The Daily Chart
On the daily chart, the price has been steadily rising, making higher highs and lows. The market has left the 200-day moving average far behind, a behavior typically seen during crypto bull markets.
Currently, the ETH price is trying to pierce through the $4,000 resistance level after failing to do so last week.
If the breakout occurs, ETH will likely reach a new all-time high. However, judging by the massive overbought signals on the RSI, a pullback looks pretty probable in the short term.

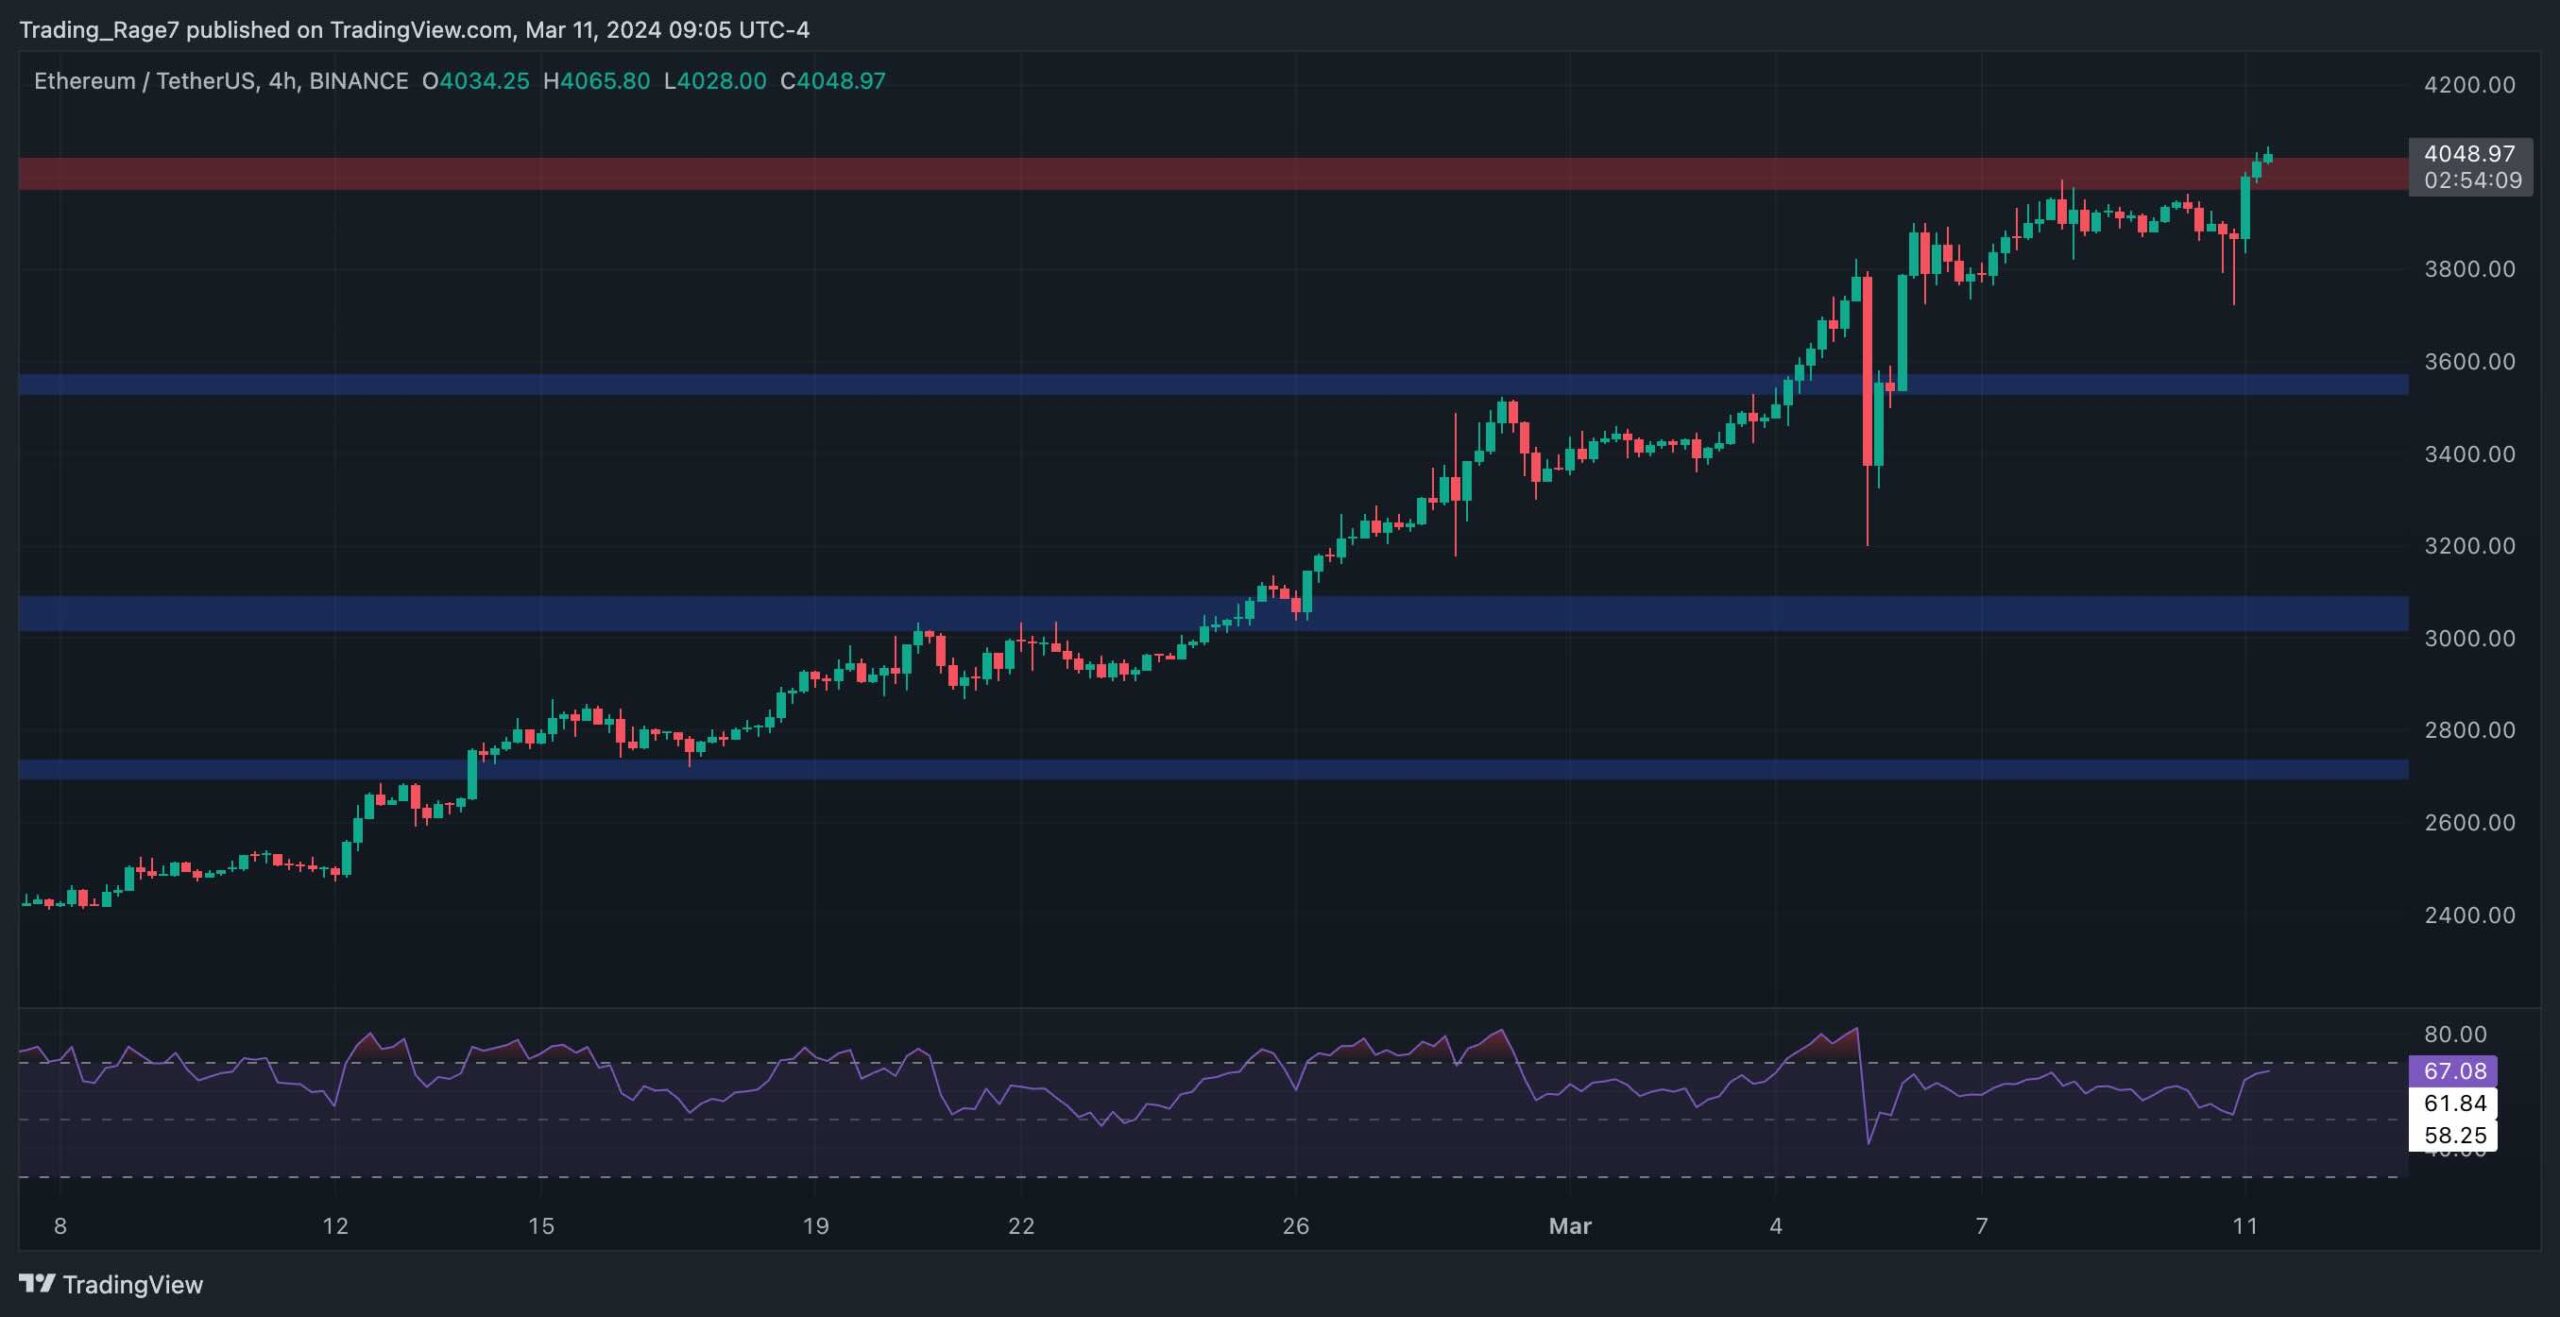
The 4-Hour Chart
Looking at the 4-hour timeframe, it is evident that the price has been consolidating below the $4,000 level for a while. Yet, the bullish momentum has seemingly kicked in again, and ETH is on the verge of blowing past the $4,000 resistance zone.
The Relative Strength Index also shows values above 50% but is still not overbought in this timeframe. Therefore, the market might still rise higher before an eventual correction.
Sentiment Analysis
By TradingRage
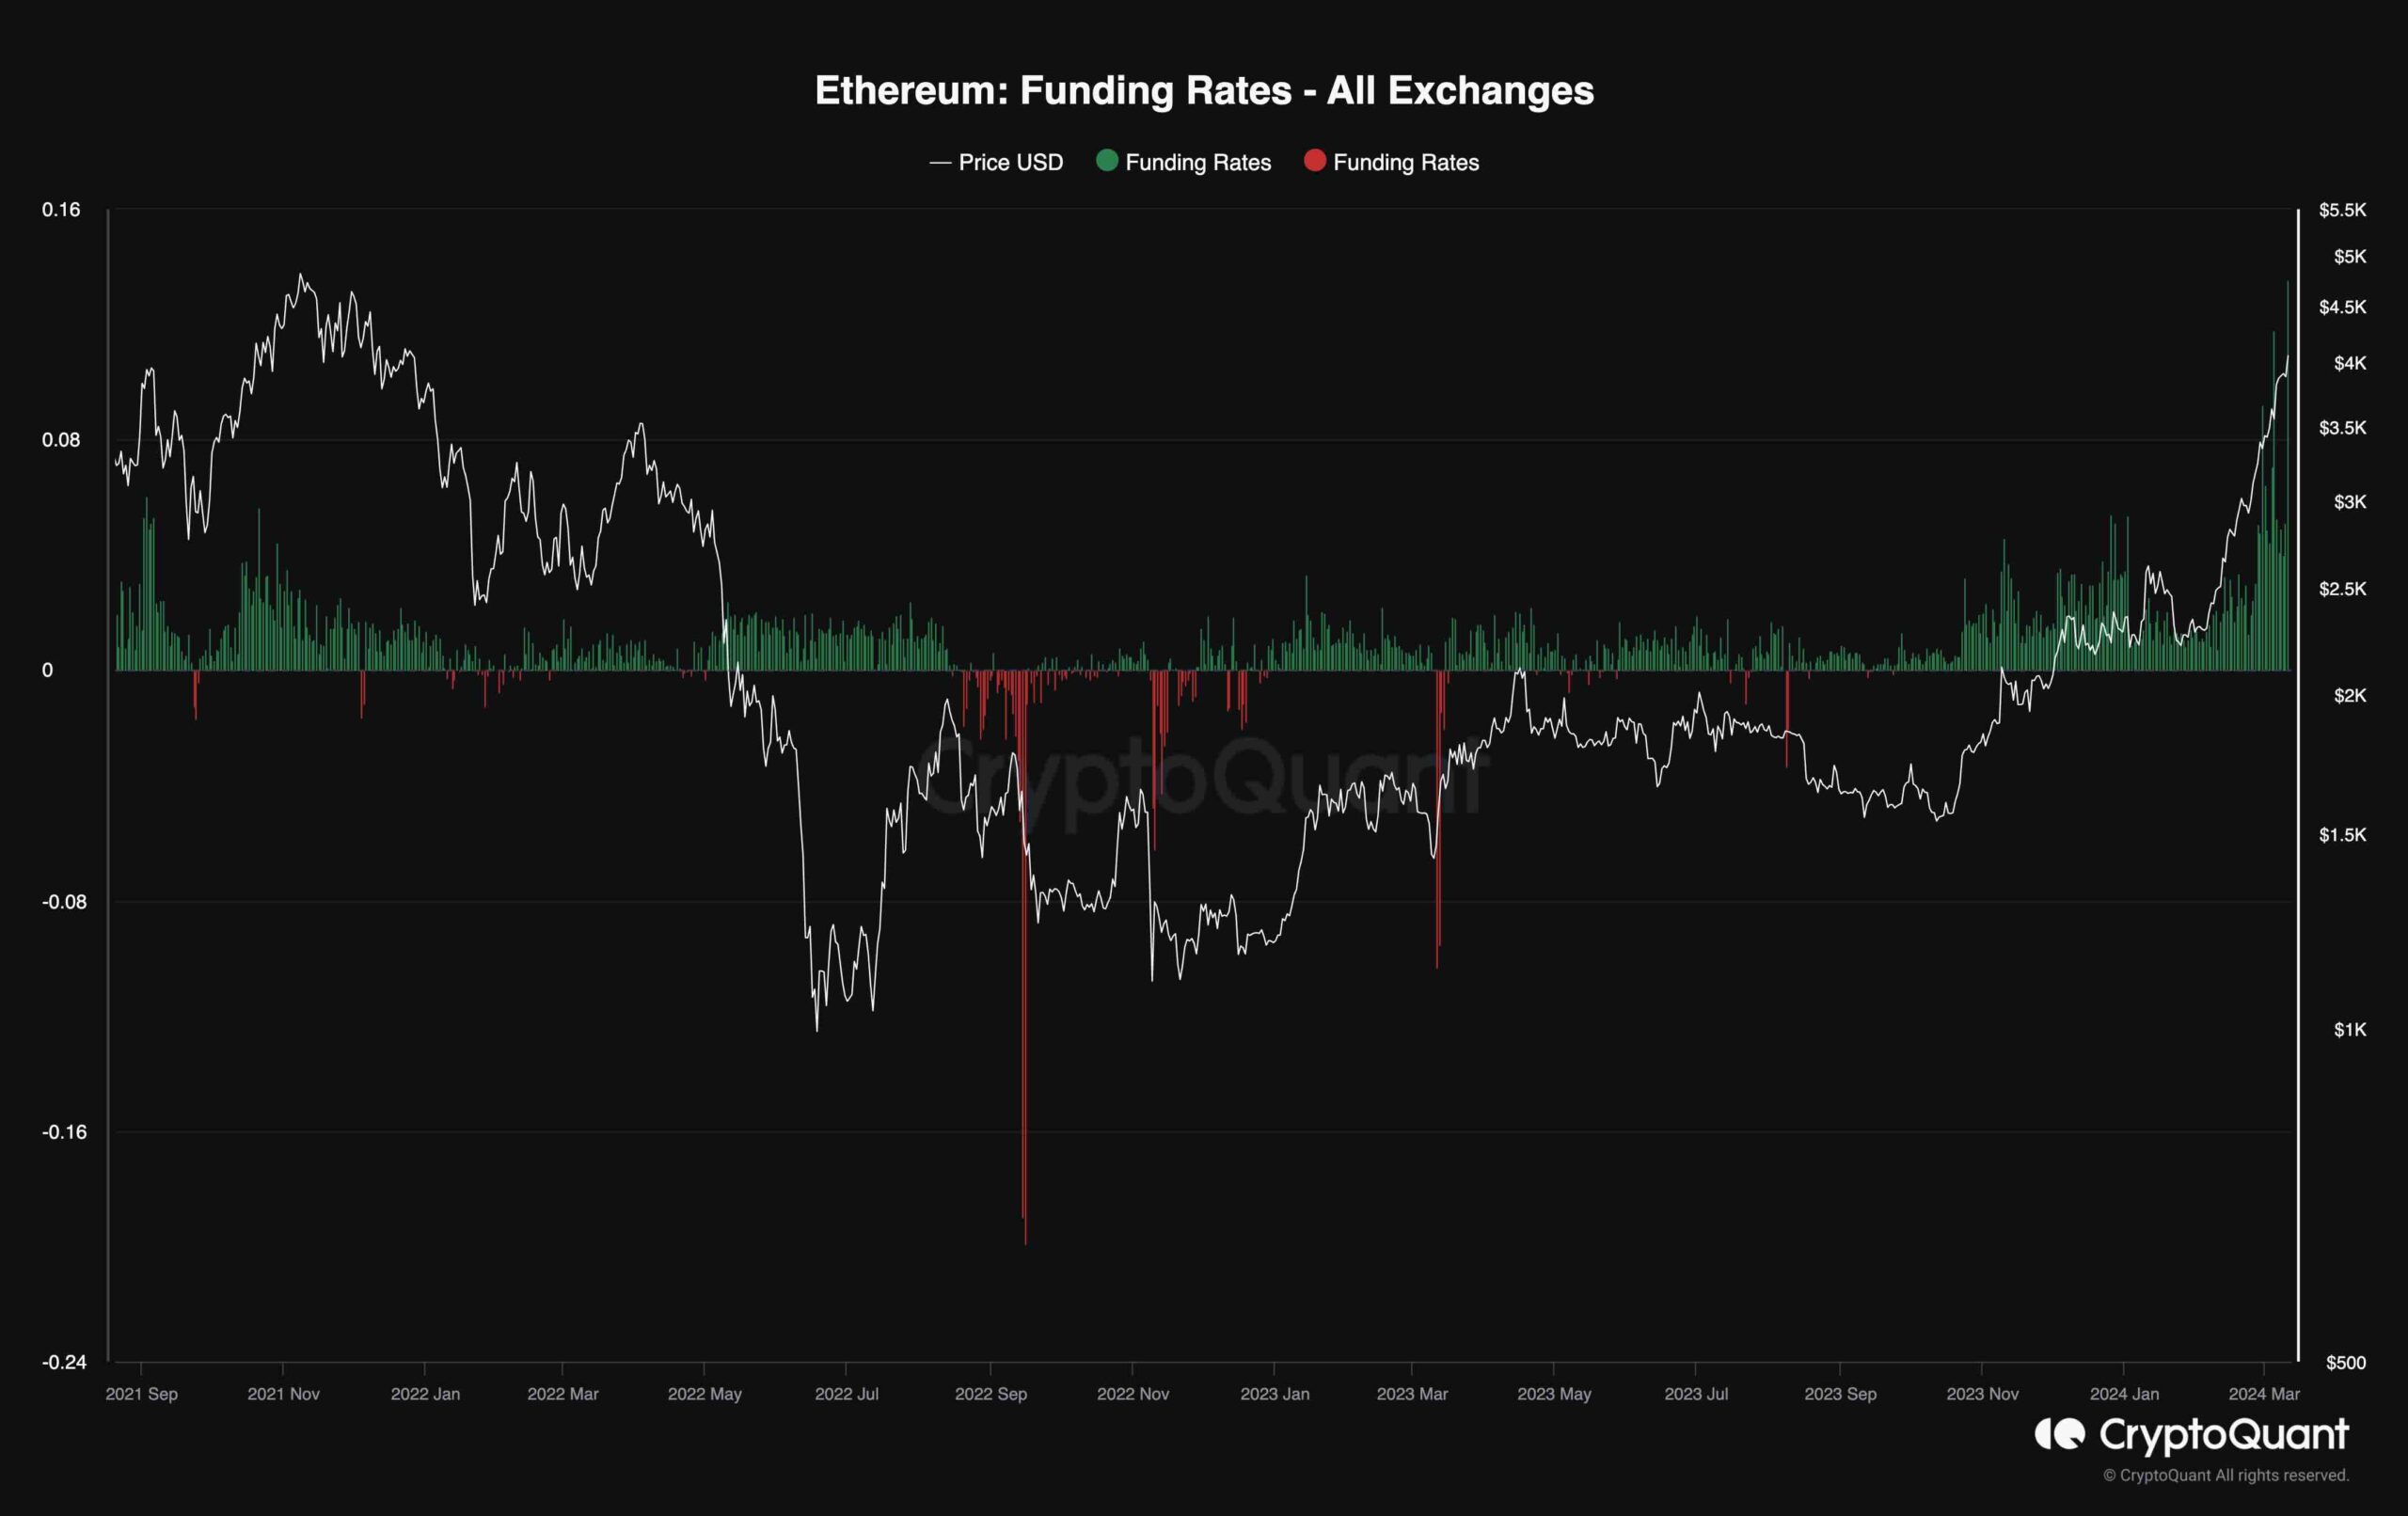
Ethereum Funding Rate
While Ethereum’s price has yet to reach a new all-time high, market participants expect the price to rally much higher. This optimistic behavior can easily be witnessed in future market sentiment.
This chart presents the Ethereum funding rates, which indicate whether the buyers or the sellers are executing their orders more aggressively on aggregate. Positive values indicate bullish sentiment, while negative values point to pessimism by market participants.
The chart demonstrates that the funding rates have been showing extremely high values recently, even higher than during the last all-time high. While this aggregate buying pressure is not inherently bad, it can lead to a potential long-liquidation cascade that could cause short-term price drops.
The post Ethereum Explodes Past $4,000 as Bulls Now Eye All-Time High Levels (ETH Price Analysis) appeared first on CryptoPotato.
What's Your Reaction?