


Is XRP About to Surge To $0.6 or Drop Back Below $0.5? (Ripple Price Analysis)
Ripple’s recent market behavior indicates an extended phase of uncertainty and sideways movement, with a slight increase in price observed recently. Despite this, XRP encounters a significant resistance zone, hinting at a possible short-term bearish rejection. XRP Analysis By Shayan The Daily Chart Examining the daily chart reveals a prolonged period of sideways trading, characterized […]
Ripple’s recent market behavior indicates an extended phase of uncertainty and sideways movement, with a slight increase in price observed recently.
Despite this, XRP encounters a significant resistance zone, hinting at a possible short-term bearish rejection.
XRP Analysis
By Shayan
The Daily Chart
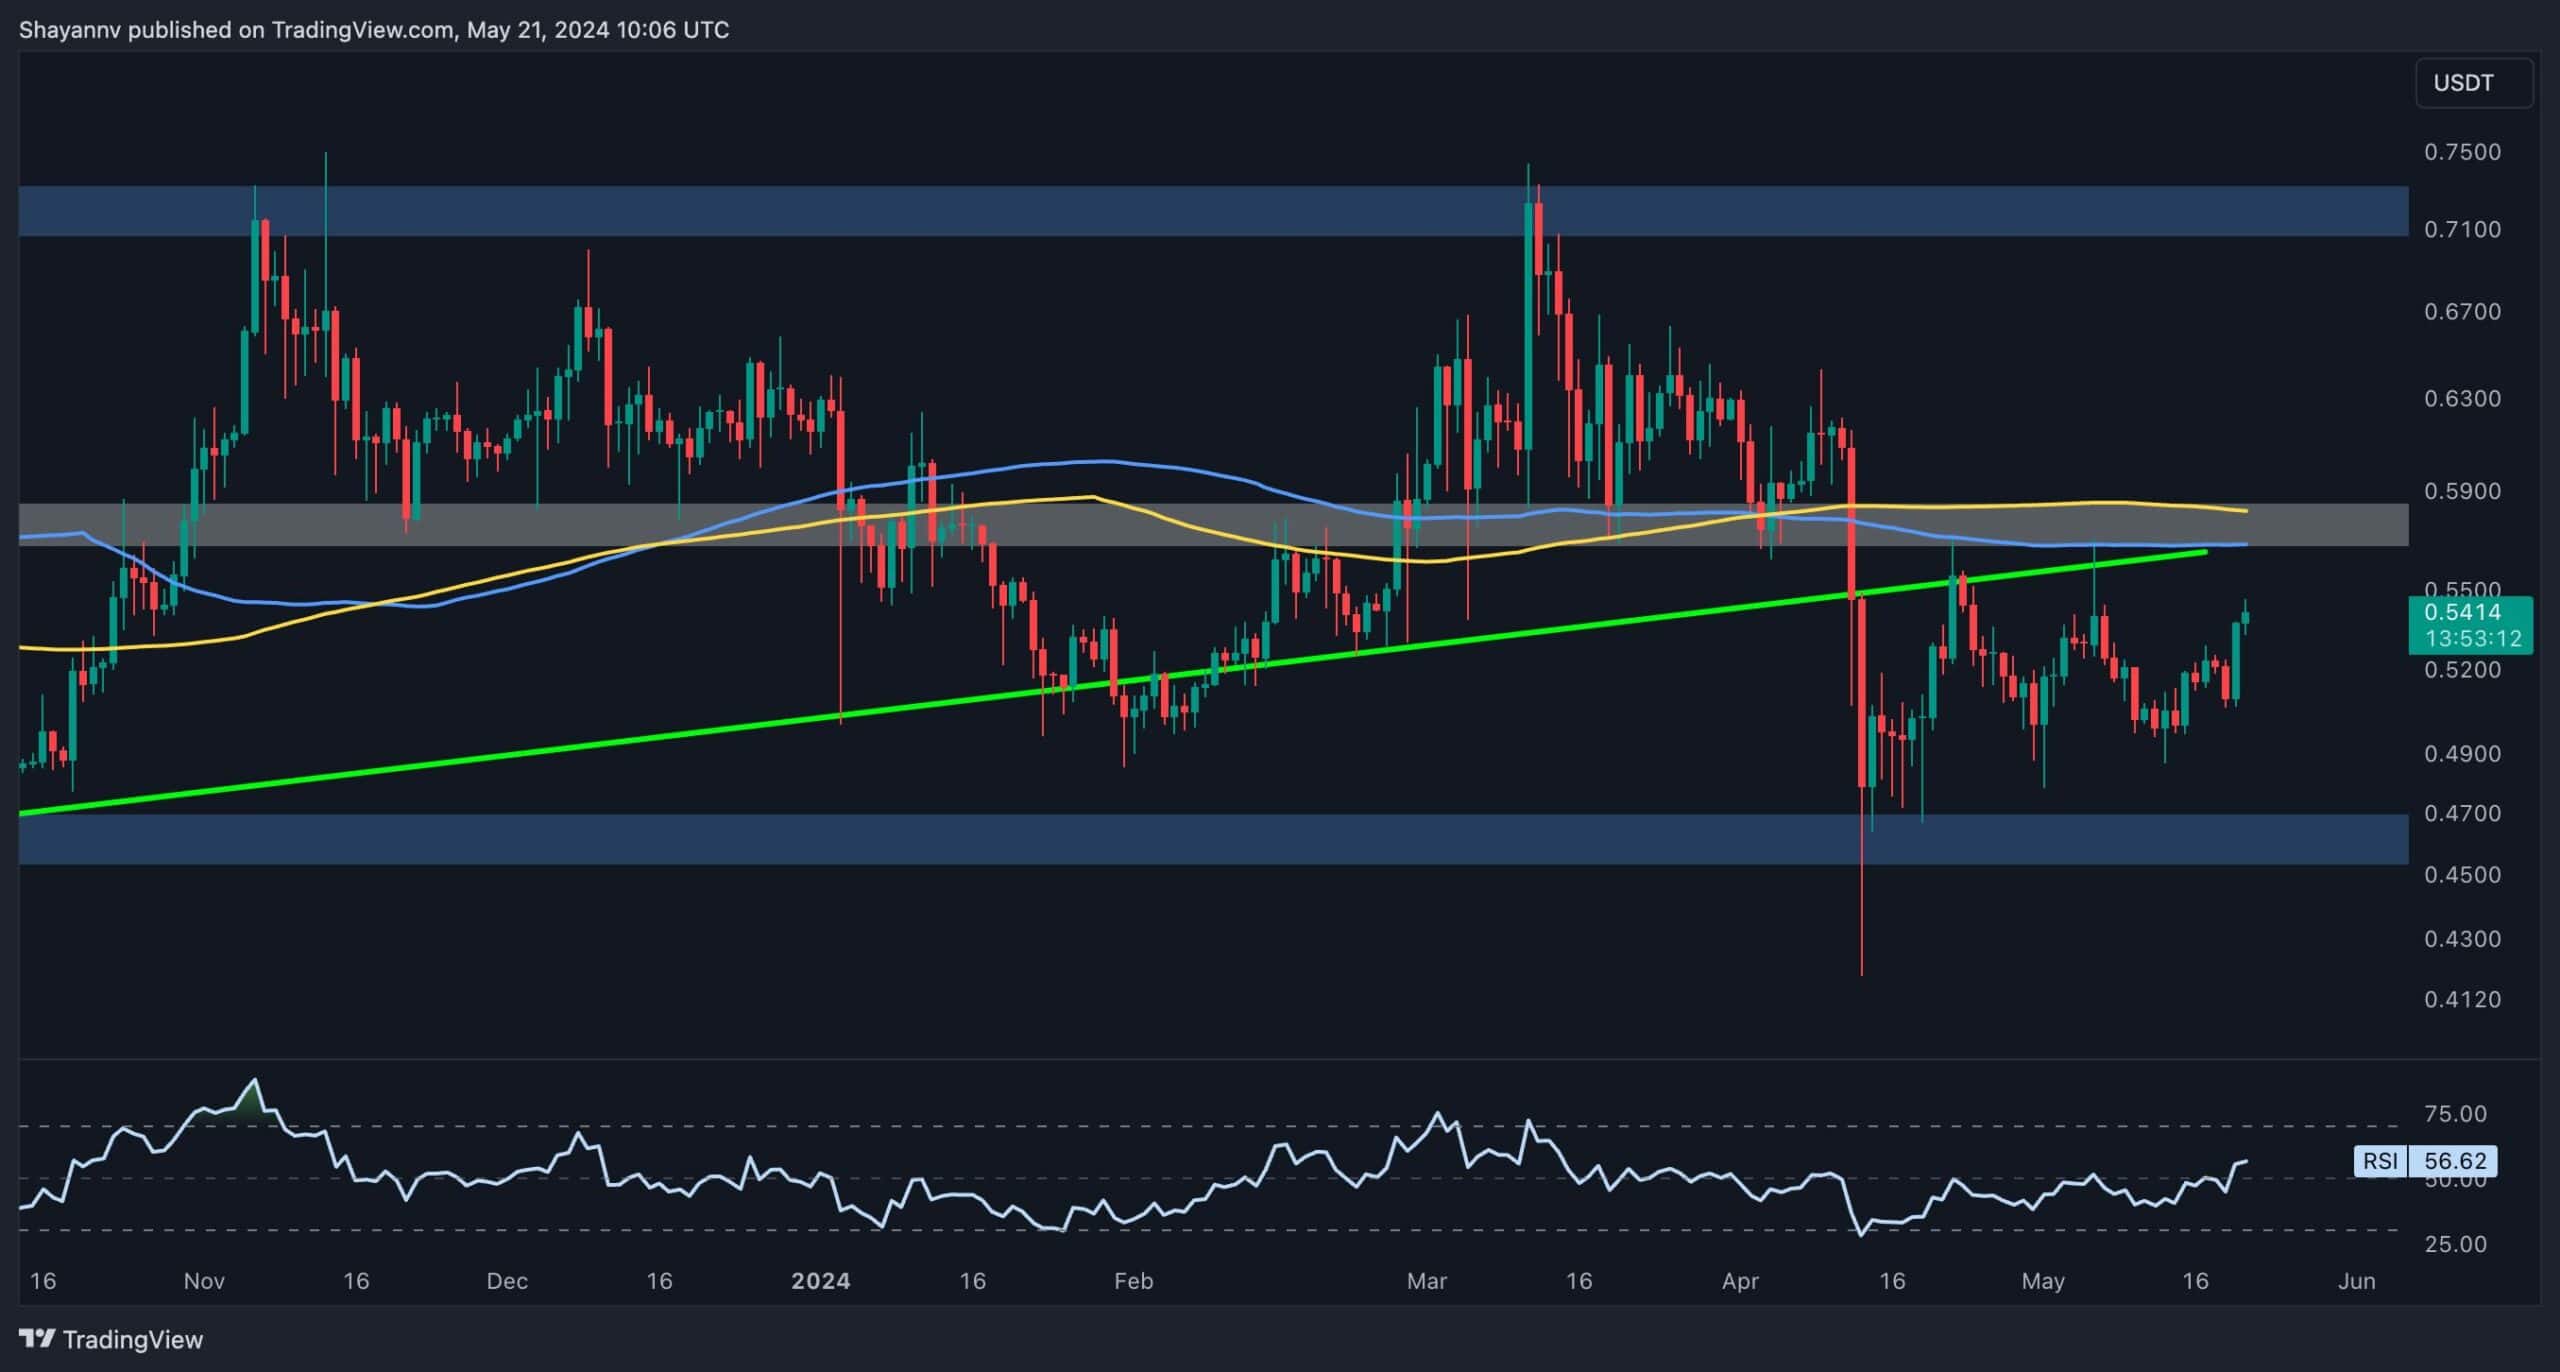
Examining the daily chart reveals a prolonged period of sideways trading, characterized by market uncertainty, with XRP’s price oscillating within a narrow range.
This range is defined by a key resistance at $0.55 and a major support level at $0.47. Recently, there has been a modest rise in demand and bullish momentum, pushing the price towards the upper boundary of this range.
However, Ripple is now contending with a crucial resistance zone that includes the range’s upper limit, the 200-day moving average, and a multi-month ascending trendline. Should buyers manage to break through this pivotal area, a sustained bullish trend could emerge.
Nonetheless, the recent price movements indicate ongoing uncertainty and a lack of definitive market direction, suggesting that Ripple might continue to trade sideways within this range until a breakout occurs.

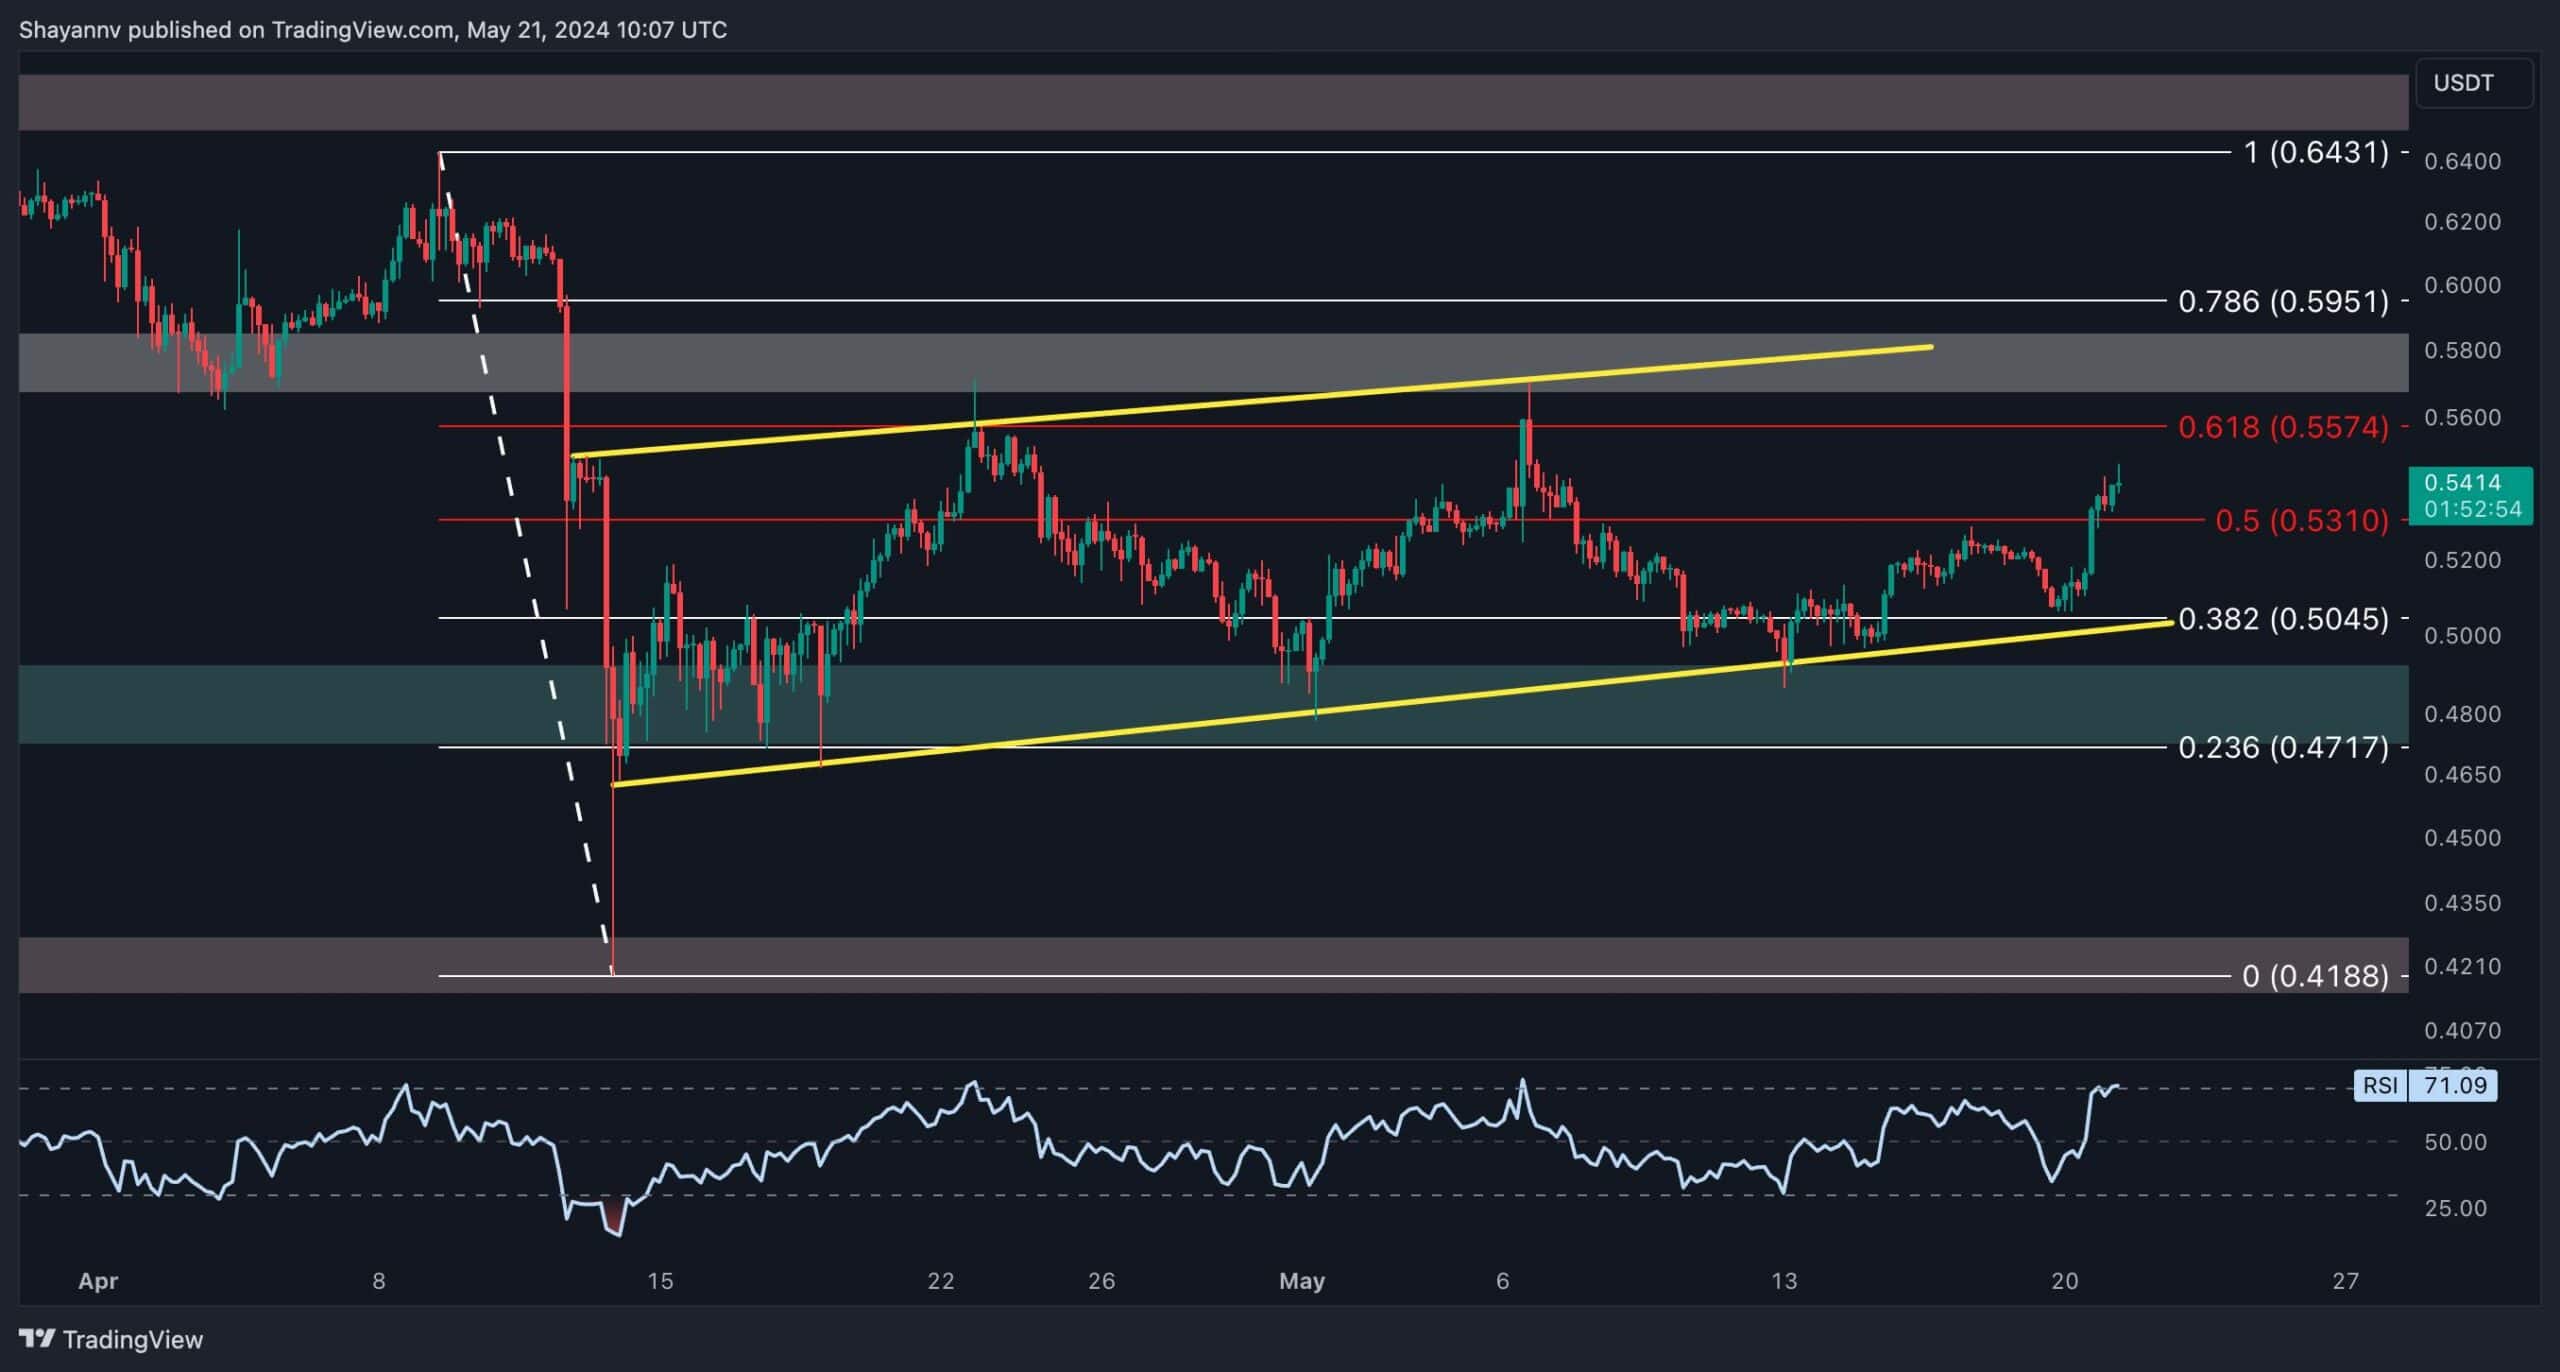
The 4-Hour Chart
On the 4-hour chart, a bullish bounce is evident near the lower boundary of an ascending wedge, around the $0.50 mark, propelling the price towards a critical resistance area. It encompasses the 0.5 ($0.5310) and 0.618 ($0.5574) Fibonacci retracement levels, areas likely to encounter significant supply and selling pressure.
Should the buyers surpass this critical resistance, a fresh bullish rally could aim to reach the wedge’s upper boundary at $0.58. Conversely, a bearish rejection at this level might trigger another decline toward the wedge’s lower boundary. A break below this key threshold could set off a prolonged bearish trend, targeting the $0.48 level in the short term.
In summary, while Ripple’s price has seen a minor uptick, it faces significant resistance levels that could dictate its next move. The market remains in a state of uncertainty, and traders should watch for either a breakout or continued consolidation within the current range.
The post Is XRP About to Surge To $0.6 or Drop Back Below $0.5? (Ripple Price Analysis) appeared first on CryptoPotato.
What's Your Reaction?